Design Case study
Scientific Visualization of Microorganisms
2D illustrations
by
Introduction
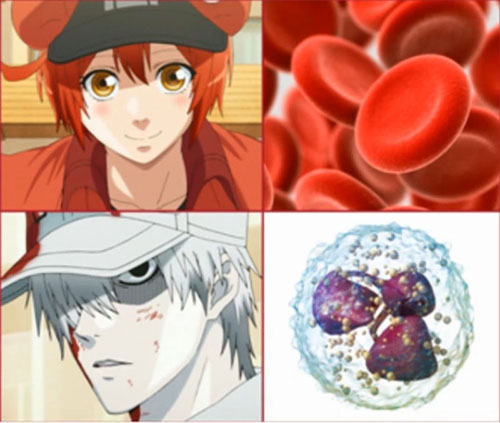
It is often the beauty of a visualization that captures our attention, sometimes seeming more like imaginative art than accurate science. The colors and shapes are so incredible that we expect it to be unreal, but realness is its most compelling aspect. This project attempts to visualize some of the microorganisms present in the human body by creating as scientifically accurate 2D illustrations as possible.
The molecular structure of cells is currently invisible to the experiment, but a view may be synthesized from data available from different research resources. Illustrations of entire microorganisms that are made up of different types of cells with molecular detail are often not created as cell biologists are more focused on specific components, their interactions, or resulting processes than on presenting a view of the organism. However, the whole organism's visualizations can be created by integrating practical information from structural biology, microscopy, and bioinformatics.
Synthesizing such visualizations can be challenging in several ways, and the results are often quite complicated with closely packed, diverse components. One needs to select methods displaying this data that tells a straightforward, coherent story. Though the available information is vast and ever-increasing, it is scattered over multiple resources in various formats. It must be gathered, synthesized, and curated to get an accurate and complete model of what is being portrayed. This report describes the scientific data and methodology for creating a scientifically precise visualization that addresses all the macromolecular components' size, shape, location, and concentration.
Case Study Download:
• Scientific Visualization of Microorganisms......